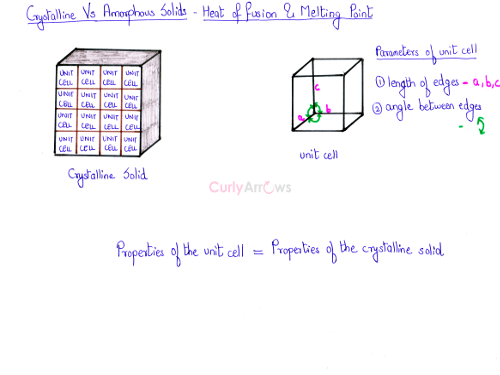
The crystalline solid is made up of the unit cells. Therefore, the properties of the unit cell turn out to be the properties of the crystalline solid. In a unit cell, the length of the edges and the angle between the edges are fixed. Therefore, the entire crystalline solid would exhibit fixed value for both these parameters.
When heat energy is provided to the solid, at a particular fixed temperature the crystalline solid would melt to liquid as all the bonds would break at the same time. The energy required to bring about the change of state from a unit mass of the solid to the liquid is called the heat of fusion and the temperature at which it happens is called the melting point.
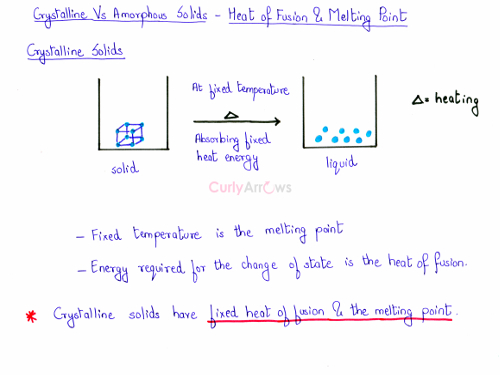
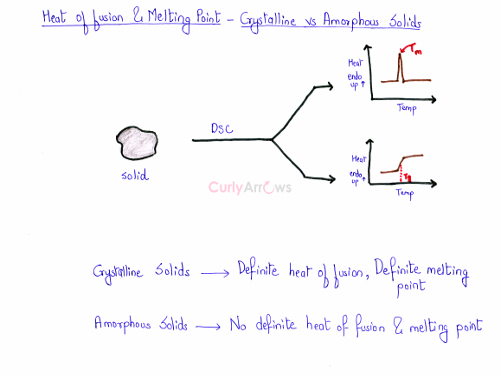
For a crystalline solid, the heat of fusion and the melting point are definite and fixed.
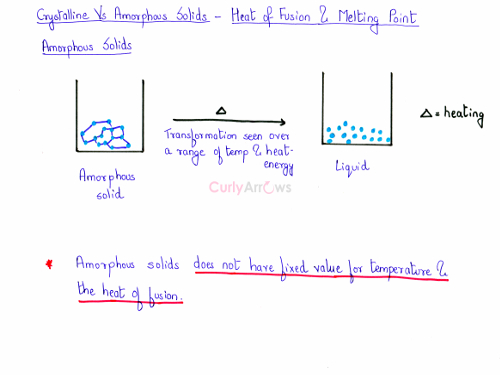
Amorphous solid, on the other hand, has no definite value of the heat of fusion and the melting point. The amorphous solid has no fixed arrangement of the particles. The bond length and bond angles differ widely within the structure of an amorphous solid. Hence, it would melt over a range of temperature. As the bond lengths maybe are longer or shorter within the structure, therefore, the energy required to break the bonds would be higher or lower.
Graphical representation of Melting for Crystalline and Amorphous Solid
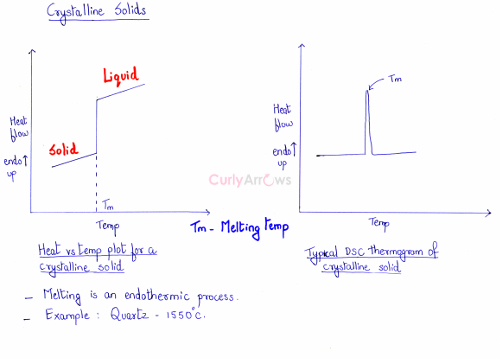
Let us understand the changes happening in the solid during its melting process. On slowly heating the crystalline solid, its temperature will increase. The particles absorb heat, its movement increases, the bonds break and then go into the liquid state. During the melting of the solid to liquid, energy is absorbed therefore it is an endothermic process. A sharp peak is seen at one particular temperature when the solid melts and goes to the liquid state.
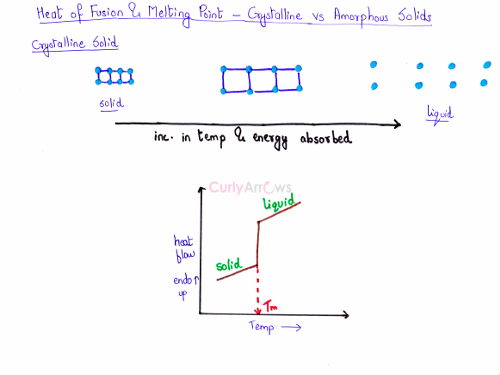
On plotting a graph of heat flow on the y-axis versus an increase in temperature on the x-axis, the transition from a crystalline solid to liquid is seen as a sharp rise. On the right, the same observation can be seen on the spectra plotted using a DSC instrument. A Differential Scanning Calorimeter (DSC) is the instrument used to measure such a change in phase and can correctly predict the melting point of a crystalline solid. The melting of the solid can be seen as a sharp, erect peak on the graph. The sharp peak indicates the correct melting point of the solid shown as Tm called the melting temperature.
For example, the melting point of crystalline solid Quartz is 1550 oC.
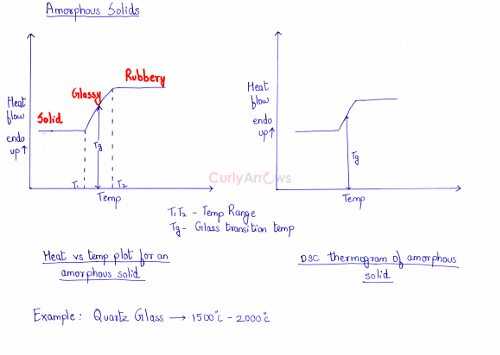
For amorphous solids, the change of phase is slow and occurs over a range of temperatures as shown from T1 to T2. It goes from the solid state to a glassy state and then to a rubbery state. The amorphous solid in the glassy state is hard, rigid and brittle. On further heating, it attains a rubbery state. It is the rubbery state that provides flexibility and softness to a polymer.
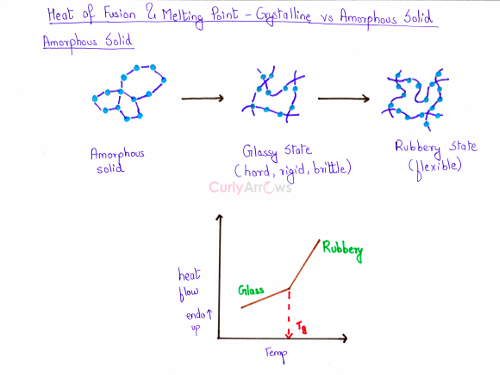
In the plotted graph and the DSC thermogram, it is seen as a slight upward curve. Therefore, the amorphous solids do not have a melting temperature but have a glass transition temperature. It is the temperature at which it attains a glassy state and is shown as Tg.
Amorphous quartz or fused silica melts over a range of temperatures from 1500 0C to 2000 0C.
Prediction of the nature of an unknown solid using a DSC instrument
Imagine that you have a solid of an unknown nature in your hand. A DSC instrument is useful to know whether it’s a crystalline solid or an amorphous. It proves it by showing a sharp erect peak for the crystalline solid and slight curve for the amorphous solids. Therefore, the nature of an unknown solid and its correct melting point can be correctly predicted using a DSC graph.
.png)